Yearly Statistics and Plots


|
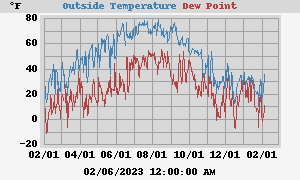
High Temperature Low Temperature |
55.9°F at 02/05/2023 01:52:21 PM 5.0°F at 01/31/2023 07:14:30 AM |
| High Heat Index | 55.9°F at 02/05/2023 01:52:21 PM |
| Low Wind Chill | -13.5°F at 02/01/2023 06:51:21 AM |
|
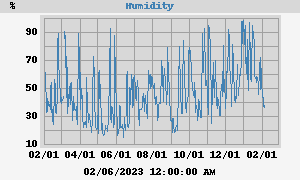
High Humidity Low Humidity |
99% 01/02/2023 10:11:38 PM 16% 02/05/2023 01:21:57 PM |
|
High Dewpoint Low Dewpoint |
37.0°F 01/02/2023 09:50:50 AM -9.9°F 01/26/2023 03:20:40 AM |
|
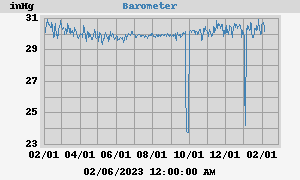
High Barometer Low Barometer |
31.000 inHg at 01/26/2023 05:24:40 AM 23.957 inHg at 01/02/2023 12:42:02 PM |
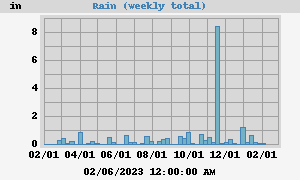
| Rain Total | 1.39 in |
| High Rain Rate | N/A at N/A |
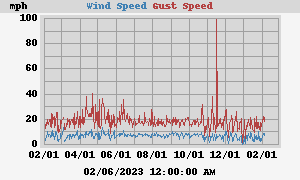
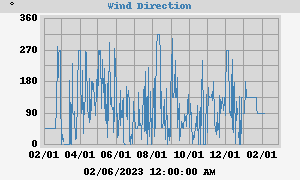
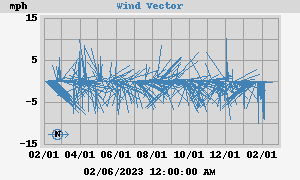
| High Wind Speed | 22 mph from 90° at 01/22/2023 07:30:04 AM |
| Average Wind | 5 mph |
| RMS Wind | 7 mph |
|
Vector Average Speed Vector Average Direction |
5 mph 114° |
|
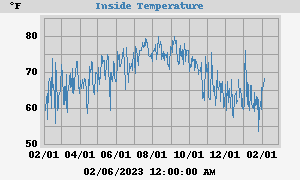
High Inside Temperature Low Inside Temperature |
86.5°F at 01/07/2023 01:27:02 PM 52.4°F at 02/01/2023 05:14:33 AM |
| Rain Year Total | 13.69 in |
| High Rain Rate | N/A at N/A |